Understanding Housing Affordability in Late 2025
Home Mortgage Cody Posey October 21, 2025
Home Mortgage Cody Posey October 21, 2025
How has housing affordability evolved—and what do today’s ratios mean for buyers navigating a high-cost market?
Affordability remains one of the most pressing challenges in real estate as 2025 winds down. Despite some cooling in home price appreciation, rising mortgage rates, elevated down payments, and tighter qualifying ratios continue to weigh heavily on buyers. Together, these factors determine not just who can purchase a home—but how sustainably they can afford to keep it.
Recent data shows affordability pressures persisting across most U.S. markets. Median down payments now average roughly 14.4%—around $30,400—with the typical buyer contributing more cash upfront than in any pre-pandemic year. While prices have stabilized slightly in some metros, higher borrowing costs have offset those gains.
Regional variations persist: affordability in the Northeast and Midwest has remained steadier, while buyers in the South and West are finally seeing improvements thanks to expanded inventory and selective price reductions.
At the policy level, the newly passed ROAD to Housing Act represents an effort to increase housing supply and ease affordability constraints—signaling that housing costs will remain a national focus heading into 2026.
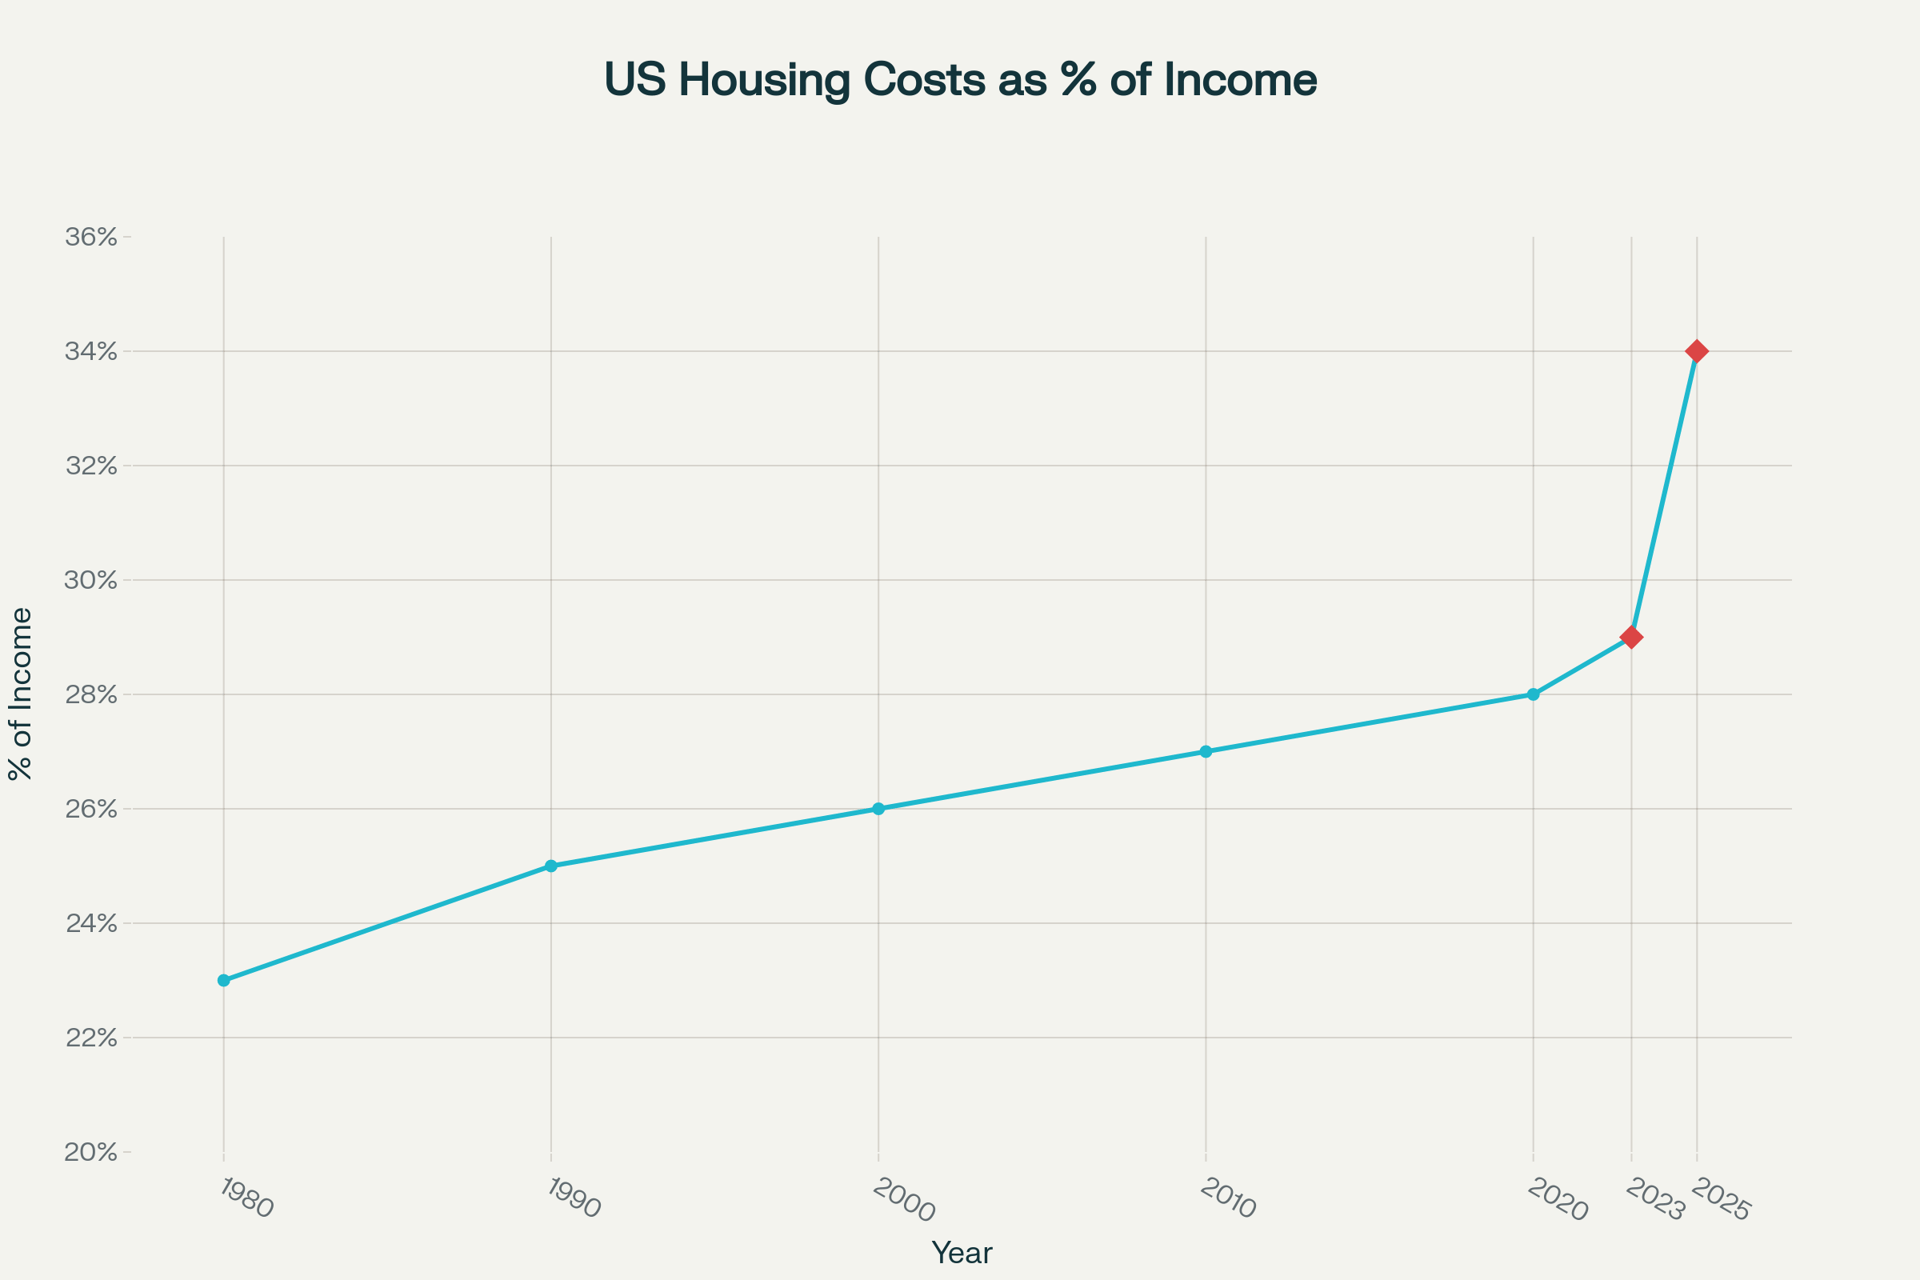
The first chart, “US Housing Costs as % of Income,” illustrates just how dramatically the cost burden has shifted.
In 1980, housing accounted for about 23% of household income. By 1990, that figure had climbed to 25%, rising steadily through the 2000s. After modest gains in the 2010s, affordability eroded sharply post-2020, with housing costs now consuming roughly 34% of income on average—a level not seen in more than four decades.
This upward trend underscores how much faster housing costs have grown relative to income. Even as wage growth accelerated in certain sectors, home prices and financing costs outpaced it, eroding real buying power.
Understanding affordability starts with understanding the front end ratio—the percentage of your gross monthly income devoted to housing expenses (including mortgage, taxes, insurance, and related costs).
Most lenders prefer this ratio to remain at or below 28% for conventional loans, and up to 31% for FHA loans. A higher ratio signals increased financial risk and may limit loan eligibility or raise borrowing costs.
Example:
If your gross monthly income is $5,000 and your total housing payment is $1,200, your front end ratio equals:
(1200/5000)×100=24%(1200 / 5000) \times 100 = 24\%
That’s comfortably within typical underwriting thresholds.
However, as today’s charted data shows, rising home prices and interest rates are pushing many buyers toward the upper bounds of those ratios—or beyond them. When that happens, lenders may require stronger compensating factors such as higher down payments, lower overall debt, or stronger credit profiles to maintain approval.
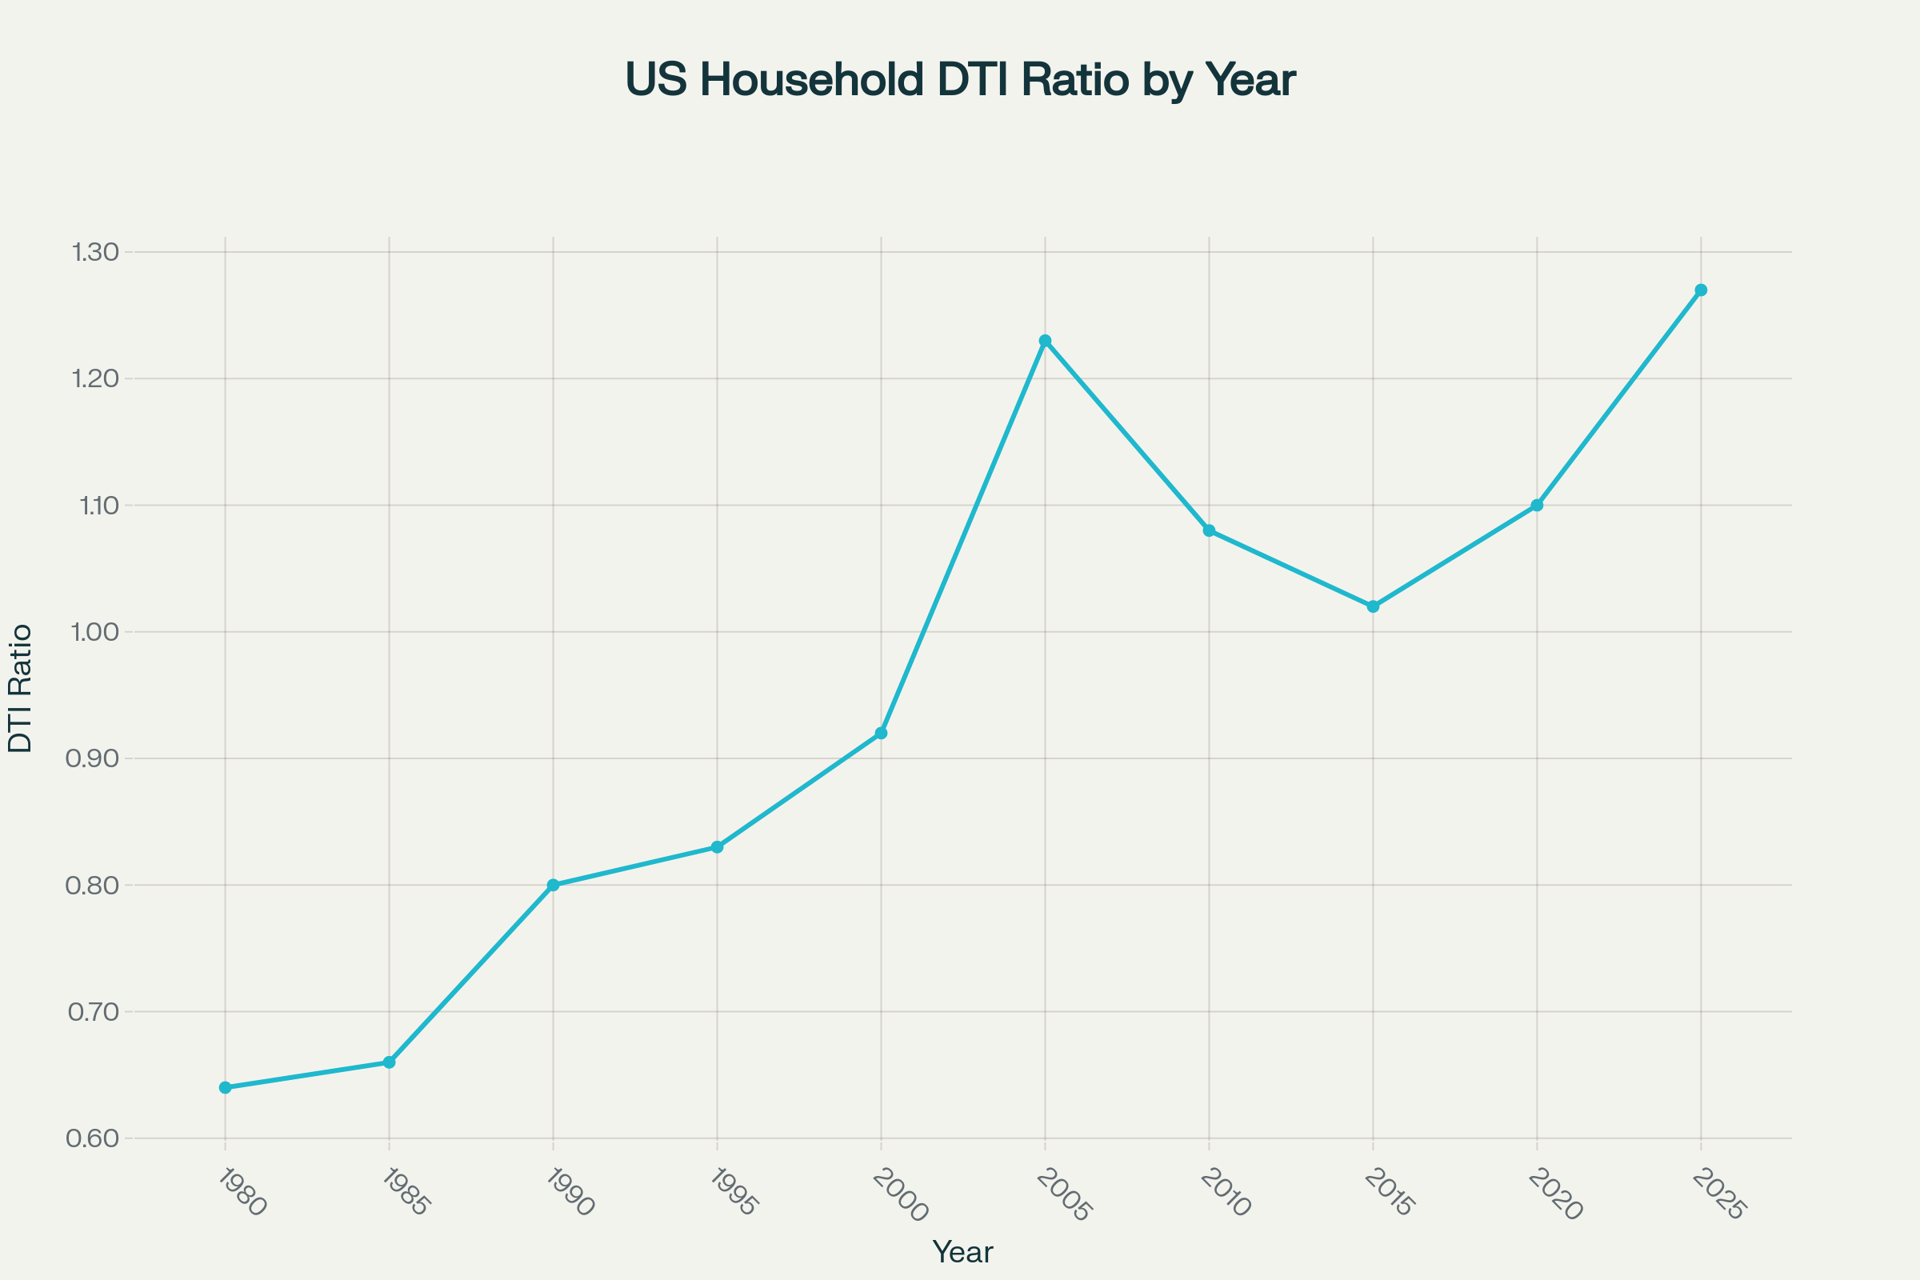
The second chart, “US Household DTI Ratio by Year,” provides a broader picture of consumer leverage and its impact on affordability.
1980s: The national household debt-to-income (DTI) ratio averaged 0.64, meaning households owed about 64% of their annual income in total debt.
1990s: The ratio climbed to 0.83 by 1995 as credit access expanded.
2000–2007: DTI peaked near 1.23 amid looser lending and rapid home price inflation.
2010s: Ratios moderated to 1.02 as households deleveraged post-crisis.
2020–2025: DTI has rebounded sharply—now near 1.27, indicating that many households carry more debt than their total annual income.
A DTI above 1.0 signals increased financial exposure. When combined with higher front end ratios and record housing costs, the data paints a clear picture: the average American household is more leveraged—and more sensitive to rate shifts—than at any point since the early 2000s.
The front end and DTI ratios are not just lender metrics—they’re key indicators of long-term financial stability.
Lower ratios support stronger loan terms, higher approval odds, and healthier monthly budgets.
Higher ratios restrict buying power and can push households toward becoming “house poor,” with limited flexibility for other expenses or savings.
For buyers, understanding these figures isn’t optional—it’s essential to navigating today’s affordability landscape. For agents, interpreting them helps frame client expectations and guide realistic home search strategies.
Rising ratios have implications beyond individual buyers. Elevated leverage constrains consumer spending, affects savings rates, and can amplify economic volatility when interest rates fluctuate. While recent policy efforts aim to expand housing supply and stabilize prices, structural affordability issues are likely to persist into 2026.
Still, opportunity remains—especially for buyers who proactively manage their debt, monitor their front end ratio, and align their home purchase within realistic financial parameters.
The story of housing affordability in 2025 is one of resilience under pressure. Despite high costs and shifting loan criteria, informed buyers and data-driven professionals can still find a path forward. By tracking metrics like the front end ratio and household DTI, you can better understand your true buying power—and make decisions that stand up to both market and economic cycles.
If you found this analysis helpful and want to stay informed about market shifts, affordability trends, and real estate insights in New Braunfels, The Hill Country and the San Antonio area, follow Cody Posey with the Phyllis Browning Company on social media for ongoing updates and strategies.

Home Buying

Selling Your Home

Selling Your Home

Selling Your Home

Selling Your Home

Selling Your Home

Selling Your Home
Home Mortgage

Home Buying
Get assistance in determining current property value, crafting a competitive offer, writing and negotiating a contract, and much more. Contact me today.